2026 season · Big South
Leaders
Winthrop's Paige Bennett leads the Big South in reception error percentage at 3.7% through Nov 7 (lower is better). USC Upstate's Summer Kohler is second at 4.2%.
Data through · last match Nov 7
Season totals and rates from every final box score. Top 50 shown; ties share a rank.
At a glance

K/S4.20
Paige Bennett
 Winthrop

Hit%.409
Maya Bukovcan
 High Point

A/S10.35
Lexi Thatcher
Winthrop
SA/S0.53
Sarah Wadsworth
 UNC Asheville

D/S4.64
Mia Jannazzo
 Radford

B/S0.70
Meredith Reisman
 Presbyterian
PTS/S4.69
Paige Bennett
WinthropRE%3.7%
Paige Bennett
WinthropTeam Hit%.248
High Point
Team Opp Hit%.172
UNC Asheville
Team Diff+.076
High Point
Team SO%61.8%
High Point
Reception error percentagelower is better
14 qualified · Min. 75% of team sets played and 4.0 reception attempts per team set.
| # | Player | Team | Pos | RA | RE%(low) |
|---|---|---|---|---|---|
| 1 | Paige BennettWinthrop · OH | Winthrop | OH | 565 | 3.7% |
| 2 | 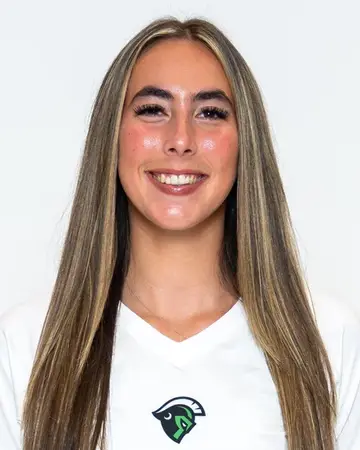 Summer Kohler  USC Upstate · OH | USC Upstate | OH | 429 | 4.2% |
| 3 | 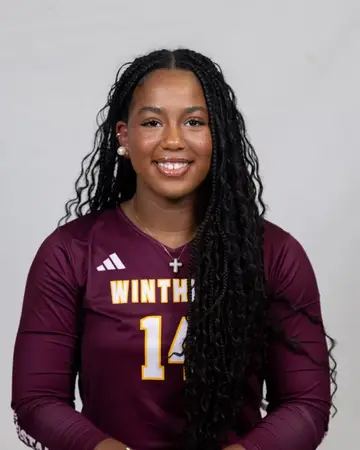 Addison TorainWinthrop · DS | Winthrop | DS | 348 | 4.3% |
| 3 |  Sophia OverholtUSC Upstate · L/DS | USC Upstate | L/DS | 484 | 4.3% |
| 5 |  Brynn Minter  Charleston So. · OH | Charleston So. | OH | 605 | 4.5% |
| 6 |  Addie BrookbankUNC Asheville · OH | UNC Asheville | OH | 660 | 4.7% |
| 6 | 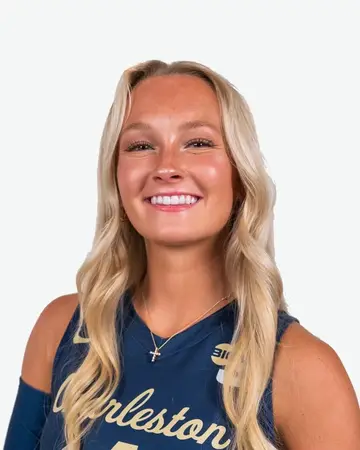 Presley MorrisCharleston So. · L/DS | Charleston So. | L/DS | 468 | 4.7% |
| 6 | Mia JannazzoRadford · OH | Radford | OH | 655 | 4.7% |
| 9 | Sarah WadsworthUNC Asheville · OH | UNC Asheville | OH | 708 | 5.1% |
| 10 |  Kiera Vazquez  Gardner-Webb · OH | Gardner-Webb | OH | 485 | 5.2% |
| 11 |  Kea WhillockHigh Point · DS | High Point | DS | 437 | 5.3% |
| 12 |  Macie PotterRadford · OH | Radford | OH | 697 | 5.5% |
| 13 |  Celimar HoyosPresbyterian · L/DS | Presbyterian | L/DS | 632 | 7.4% |
| 14 |  Addison CunnaginRadford · OH | Radford | OH | 451 | 8.4% |
Qualifiers
- Every per-set and percentage stat requires playing in at least 75% of the team's sets. Team sets come from final scoreboards.
- Hitting %: also 3.0 attack attempts per team set. Ace %: also 1.5 serve attempts per team set. Reception error %: also 4.0 reception attempts per team set.
- Season totals have no minimum.
- Teams need at least 12 box scores to appear (half the typical D1 team's count). This keeps out non-D1 opponents that show up in a single match. Sideout % and break % use play-by-play and need it for at least half of a team's matches.
- Blocks = solo blocks + 0.5 × block assists. Ace % = aces ÷ serve attempts. Hitting % = (K − E) ÷ TA.