2026 season · Division I
Leaders
Nebraska leads D1 in team hitting percentage at .337 through Nov 5. Pittsburgh is second at .333.
Data through · last match Nov 5
Season totals and rates from every final box score. Top 50 shown; ties share a rank.
At a glance
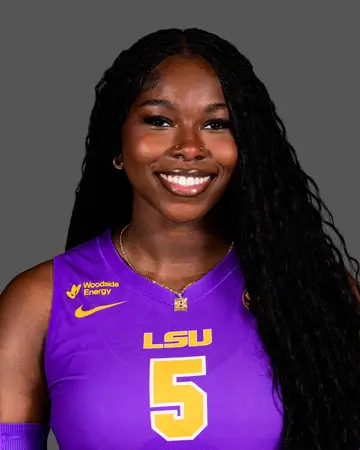
K/S5.13
Jurnee Robinson
 LSU
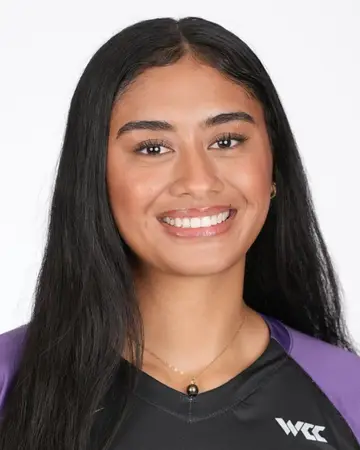
Hit%.519
Taina Kaauwai
 Portland
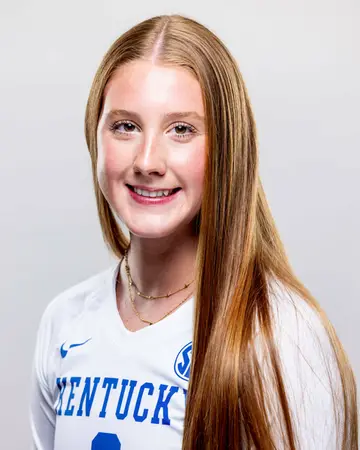
A/S11.68
Kassie O'Brien
 Kentucky
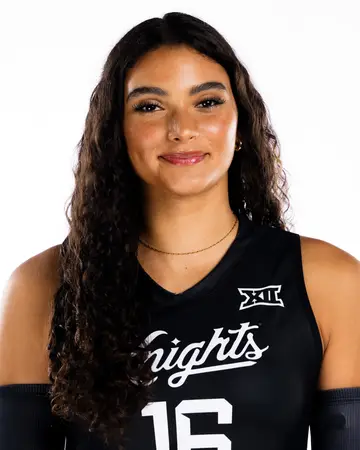
SA/S0.72
Natasha Casey
 UCF
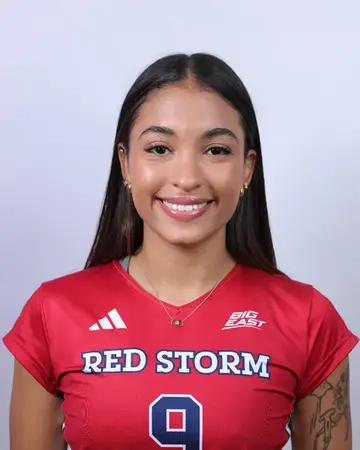
D/S5.47
Rashanny Solano Smith
 St. John's (NY)
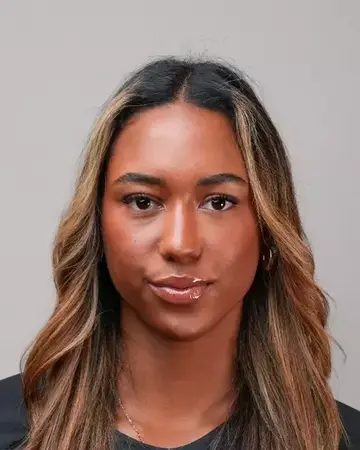
B/S1.16
Ava Bogan
 Cornell
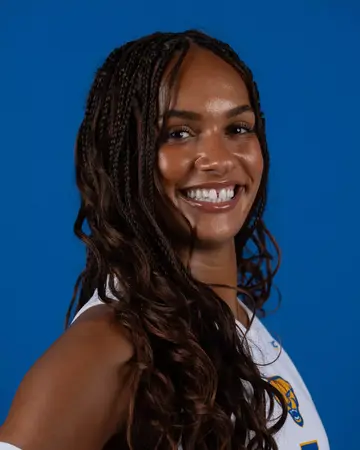
PTS/S5.99
Olivia Babcock
 Pittsburgh
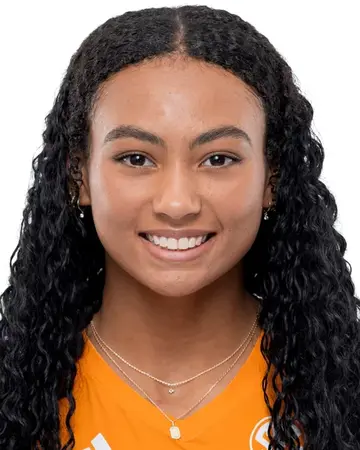
RE%0.9%
Jalyn Stout
 Tennessee

Team Hit%.337
Nebraska
Team Opp Hit%.110
Nebraska
Team Diff+.227
Nebraska
Team SO%70.4%
Nebraska
Team hitting percentage
348 qualified · Min. 11 matches.
| # | Team | Conf | TA | Hit% |
|---|---|---|---|---|
| 1 | NebraskaBig Ten | Big Ten | 2261 | .337 |
| 2 | PittsburghACC | ACC | 2260 | .333 |
| 3 |  LouisvilleACC | ACC | 2659 | .313 |
| 4 |  BYUBig 12 | Big 12 | 2290 | .301 |
| 5 |  Western Ky.C-USA | C-USA | 2761 | .291 |
| 6 |  Cal PolyBig West | Big West | 2514 | .290 |
| 6 |  VanderbiltSEC | SEC | 2305 | .290 |
| 8 |  KansasBig 12 | Big 12 | 2614 | .285 |
| 9 |  SMUACC | ACC | 2545 | .283 |
| 10 | TennesseeSEC | SEC | 2529 | .282 |
| 11 |  FloridaSEC | SEC | 2436 | .278 |
| 12 |  Southeast Mo. St.OVC | OVC | 2998 | .277 |
| 13 |  WisconsinBig Ten | Big Ten | 2977 | .276 |
| 13 | KentuckySEC | SEC | 2548 | .276 |
| 15 |  FairfieldMAAC | MAAC | 3219 | .275 |
| 15 | UCFBig 12 | Big 12 | 2615 | .275 |
| 17 |  MinnesotaBig Ten | Big Ten | 2482 | .274 |
| 18 |  IllinoisBig Ten | Big Ten | 3066 | .273 |
| 19 |  Michigan St.Big Ten | Big Ten | 2692 | .272 |
| 19 |  LindenwoodOVC | OVC | 2838 | .272 |
| 21 |  MichiganBig Ten | Big Ten | 3020 | .271 |
| 21 |  StanfordACC | ACC | 2776 | .271 |
| 21 |  Col. of CharlestonCAA | CAA | 2638 | .271 |
| 24 |  TCUBig 12 | Big 12 | 2679 | .268 |
| 25 |  DukeACC | ACC | 2863 | .267 |
| 26 |  TulaneAmerican | American | 2844 | .266 |
| 27 |  Penn St.Big Ten | Big Ten | 2747 | .263 |
| 28 |  MissouriSEC | SEC | 2798 | .261 |
| 29 |  North CarolinaACC | ACC | 2446 | .260 |
| 29 |  Ball St.MAC | MAC | 3095 | .260 |
| 29 |  WoffordSoCon | SoCon | 3497 | .260 |
| 32 |  IowaBig Ten | Big Ten | 3335 | .259 |
| 32 |  IndianaBig Ten | Big Ten | 2479 | .259 |
| 34 |  BaylorBig 12 | Big 12 | 2581 | .258 |
| 34 |  MarylandBig Ten | Big Ten | 2662 | .258 |
| 36 |  LehighPatriot | Patriot | 2481 | .257 |
| 36 |  CincinnatiBig 12 | Big 12 | 2409 | .257 |
| 36 |  OklahomaSEC | SEC | 2565 | .257 |
| 39 |  PurdueBig Ten | Big Ten | 2753 | .256 |
| 39 |  Fla. AtlanticAmerican | American | 3192 | .256 |
| 39 |  LibertyC-USA | C-USA | 2952 | .256 |
| 39 |  Ga. SouthernSun Belt | Sun Belt | 3399 | .256 |
| 43 |  Eastern Ky.UAC | UAC | 3425 | .255 |
| 44 |  Wright St.Horizon | Horizon | 2742 | .254 |
| 44 |  OregonBig Ten | Big Ten | 2888 | .254 |
| 46 |  YaleIvy League | Ivy League | 2201 | .253 |
| 47 |  AmericanPatriot | Patriot | 3013 | .252 |
| 47 |  San DiegoWCC | WCC | 2542 | .252 |
| 47 |  Mississippi St.SEC | SEC | 2697 | .252 |
| 50 |  UtahBig 12 | Big 12 | 2466 | .251 |
Qualifiers
- Every per-set and percentage stat requires playing in at least 75% of the team's sets. Team sets come from final scoreboards.
- Hitting %: also 3.0 attack attempts per team set. Ace %: also 1.5 serve attempts per team set. Reception error %: also 4.0 reception attempts per team set.
- Season totals have no minimum.
- Teams need at least 11 box scores to appear (half the typical D1 team's count). This keeps out non-D1 opponents that show up in a single match. Sideout % and break % use play-by-play and need it for at least half of a team's matches.
- Blocks = solo blocks + 0.5 × block assists. Ace % = aces ÷ serve attempts. Hitting % = (K − E) ÷ TA.