2026 season · SWAC
Leaders
Florida A&M leads the SWAC in break (point-scoring) percentage at 47.3% through Nov 8. Bethune-Cookman is second at 46.2%.
Data through · last match Nov 8
Season totals and rates from every final box score. Top 50 shown; ties share a rank.
At a glance

K/S3.77
Alaya Rhodes
 Bethune-Cookman

Hit%.386
Shelby Zanders
 Jackson St.

A/S9.24
Kamrynn Clay
 Alabama St.

SA/S0.45
Rayishon Jackman
 Alabama A&M

D/S5.09
Najah Harris
 Southern U.
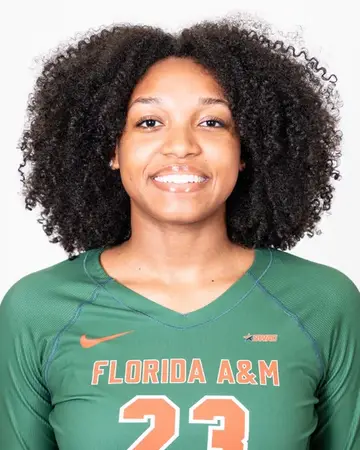
B/S0.60
Farah Farooq
 Florida A&M
PTS/S4.24
Alaya Rhodes
Bethune-CookmanRE%2.8%
Rayishon Jackman
Alabama A&MTeam Hit%.237
Alabama A&M
Team Opp Hit%.170
Bethune-Cookman
Team Diff+.053
Alabama A&M
Team SO%59.6%
Alabama A&M
Break (point-scoring) percentage
12 qualified · Min. 12 matches, with play-by-play for at least half of them.
| # | Team | Conf | Srv | BP% |
|---|---|---|---|---|
| 1 | Florida A&MSWAC | SWAC | 2245 | 47.3% |
| 2 | Bethune-CookmanSWAC | SWAC | 1846 | 46.2% |
| 3 |  GramblingSWAC | SWAC | 2123 | 45.5% |
| 4 | Alabama A&MSWAC | SWAC | 2297 | 45.1% |
| 4 | Jackson St.SWAC | SWAC | 2071 | 45.1% |
| 6 | Southern U.SWAC | SWAC | 1953 | 43.5% |
| 7 |  Texas SouthernSWAC | SWAC | 1840 | 42.9% |
| 8 | Alabama St.SWAC | SWAC | 2039 | 42.1% |
| 9 |  Ark.-Pine BluffSWAC | SWAC | 1777 | 42.0% |
| 10 |  Prairie ViewSWAC | SWAC | 2040 | 41.5% |
| 11 |  AlcornSWAC | SWAC | 1595 | 40.3% |
| 12 |  Mississippi Val.SWAC | SWAC | 1304 | 37.3% |
Qualifiers
- Every per-set and percentage stat requires playing in at least 75% of the team's sets. Team sets come from final scoreboards.
- Hitting %: also 3.0 attack attempts per team set. Ace %: also 1.5 serve attempts per team set. Reception error %: also 4.0 reception attempts per team set.
- Season totals have no minimum.
- Teams need at least 12 box scores to appear (half the typical D1 team's count). This keeps out non-D1 opponents that show up in a single match. Sideout % and break % use play-by-play and need it for at least half of a team's matches.
- Blocks = solo blocks + 0.5 × block assists. Ace % = aces ÷ serve attempts. Hitting % = (K − E) ÷ TA.