2026 season · MVC
Leaders
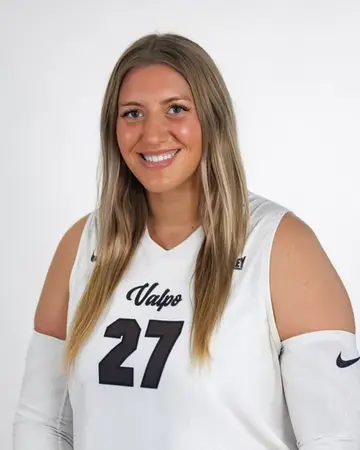
UNI's Jadyn Petersen leads the MVC in reception error percentage at 1.5% through Nov 7 (lower is better). UNI's Cassidy Hartman is second at 3.6%.
Data through · last match Nov 7
Season totals and rates from every final box score. Top 50 shown; ties share a rank.
At a glance



Reception error percentagelower is better
21 qualified · Min. 75% of team sets played and 4.0 reception attempts per team set.
| # | Player | Team | Pos | RA | RE%(low) |
|---|---|---|---|---|---|
| 1 | 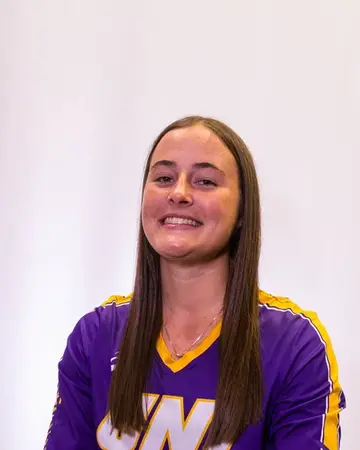 Jadyn Petersen  UNI · DS | UNI | DS | 409 | 1.5% |
| 2 |  Cassidy HartmanUNI · OH | UNI | OH | 591 | 3.6% |
| 3 |  Emma Colombari  UIC · OH | UIC | OH | 415 | 3.9% |
| 3 |  Mija Sagadin Pristovnik  Murray St. · OH | Murray St. | OH | 644 | 3.9% |
| 5 |  Jasmine Dulan  Drake · L/DS | Drake | L/DS | 480 | 4.2% |
| 5 |  Ada TamturkMurray St. · L/DS | Murray St. | L/DS | 431 | 4.2% |
| 7 |  Samantha Bunch  Illinois St. · L/DS | Illinois St. | L/DS | 525 | 4.4% |
| 8 |  Tamara KisicUIC · OH | UIC | OH | 670 | 4.5% |
| 8 |  Kira Holland  Indiana St. · OH | Indiana St. | OH | 750 | 4.5% |
| 10 |  Gracie Furlong  Bradley · OH | Bradley | OH | 832 | 4.6% |
| 11 |  Jillian Shaneyfelt  Southern Ill. · L/DS | Southern Ill. | L/DS | 619 | 4.7% |
| 12 |  Lauren Evans  Belmont · DS | Belmont | DS | 440 | 5.0% |
| 13 |  Brooke Herdes  Evansville · OH | Evansville | OH | 506 | 5.1% |
| 14 |  Mya BoltonBelmont · L/DS | Belmont | L/DS | 389 | 5.4% |
| 15 |  McKenzie MoellerSouthern Ill. · OH | Southern Ill. | OH | 645 | 5.7% |
| 16 |  Eirini BitsaktsiBradley · L/DS | Bradley | L/DS | 417 | 5.8% |
| 16 |  Jordyn Gove  Valparaiso · OH | Valparaiso | OH | 607 | 5.8% |
| 18 |  Matthea DaltonDrake · OH | Drake | OH | 470 | 6.0% |
| 19 |  Kendall AglerEvansville · L/DS | Evansville | L/DS | 576 | 6.8% |
| 19 |  Ava YoungUIC · L/DS | UIC | L/DS | 486 | 6.8% |
| 21 | 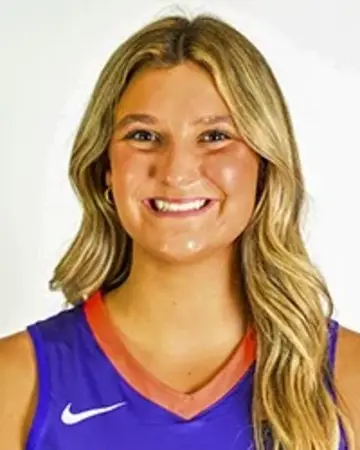 Wren JonesEvansville · OH | Evansville | OH | 449 | 10.0% |
Qualifiers
- Every per-set and percentage stat requires playing in at least 75% of the team's sets. Team sets come from final scoreboards.
- Hitting %: also 3.0 attack attempts per team set. Ace %: also 1.5 serve attempts per team set. Reception error %: also 4.0 reception attempts per team set.
- Season totals have no minimum.
- Teams need at least 12 box scores to appear (half the typical D1 team's count). This keeps out non-D1 opponents that show up in a single match. Sideout % and break % use play-by-play and need it for at least half of a team's matches.
- Blocks = solo blocks + 0.5 × block assists. Ace % = aces ÷ serve attempts. Hitting % = (K − E) ÷ TA.