2026 season · MAAC
Leaders
Fairfield leads the MAAC in hitting percentage differential at +.090 through Nov 7. Marist is second at +.054.
Data through · last match Nov 7
Season totals and rates from every final box score. Top 50 shown; ties share a rank.
At a glance

K/S3.87
Mary Claire Deacy
 Siena
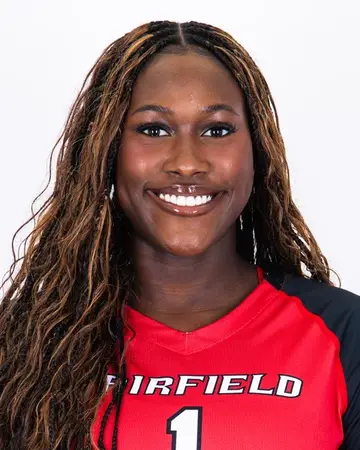
Hit%.395
Mamie Krubally
 Fairfield

A/S10.19
Caelyn Dumas
 Marist

SA/S0.58
Abbie Hagedorn
 Sacred Heart

D/S5.02
Brooke Malek
Siena
B/S0.76
Harlan Wyche
Fairfield
PTS/S4.43
Mallory Reck
Marist
RE%3.9%
Mckenna Shotwell
 Merrimack
Team Hit%.271
Fairfield
Team Opp Hit%.180
Sacred Heart
Team Diff+.090
Fairfield
Team SO%60.2%
Fairfield
Hitting percentage differential
12 qualified · Min. 12 matches.
| # | Team | Conf | Opp | Diff |
|---|---|---|---|---|
| 1 | FairfieldMAAC | MAAC | .181 | +.090 |
| 2 | MaristMAAC | MAAC | .195 | +.054 |
| 3 | SienaMAAC | MAAC | .197 | +.025 |
| 4 | Sacred HeartMAAC | MAAC | .180 | +.014 |
| 5 |  IonaMAAC | MAAC | .182 | -.019 |
| 6 |  QuinnipiacMAAC | MAAC | .210 | -.034 |
| 7 |  RiderMAAC | MAAC | .213 | -.036 |
| 8 |  Saint Peter'sMAAC | MAAC | .247 | -.080 |
| 9 |  ManhattanMAAC | MAAC | .246 | -.083 |
| 10 |  CanisiusMAAC | MAAC | .255 | -.084 |
| 11 | MerrimackMAAC | MAAC | .230 | -.097 |
| 12 |  NiagaraMAAC | MAAC | .273 | -.131 |
Qualifiers
- Every per-set and percentage stat requires playing in at least 75% of the team's sets. Team sets come from final scoreboards.
- Hitting %: also 3.0 attack attempts per team set. Ace %: also 1.5 serve attempts per team set. Reception error %: also 4.0 reception attempts per team set.
- Season totals have no minimum.
- Teams need at least 12 box scores to appear (half the typical D1 team's count). This keeps out non-D1 opponents that show up in a single match. Sideout % and break % use play-by-play and need it for at least half of a team's matches.
- Blocks = solo blocks + 0.5 × block assists. Ace % = aces ÷ serve attempts. Hitting % = (K − E) ÷ TA.